Air Quality Monitoring
For the latest ozone concentrations, for ozone
exceedances, and real time air quality data go to:

Continuous Countywide Outdoor
Air Monitoring
Ozone, carbon monoxide, nitrogen dioxide, particulate
matter, sulfur dioxide and lead can be found in Ventura
County’s air. These chemicals, called criteria pollutants,
are harmful to our health, materials and agriculture.
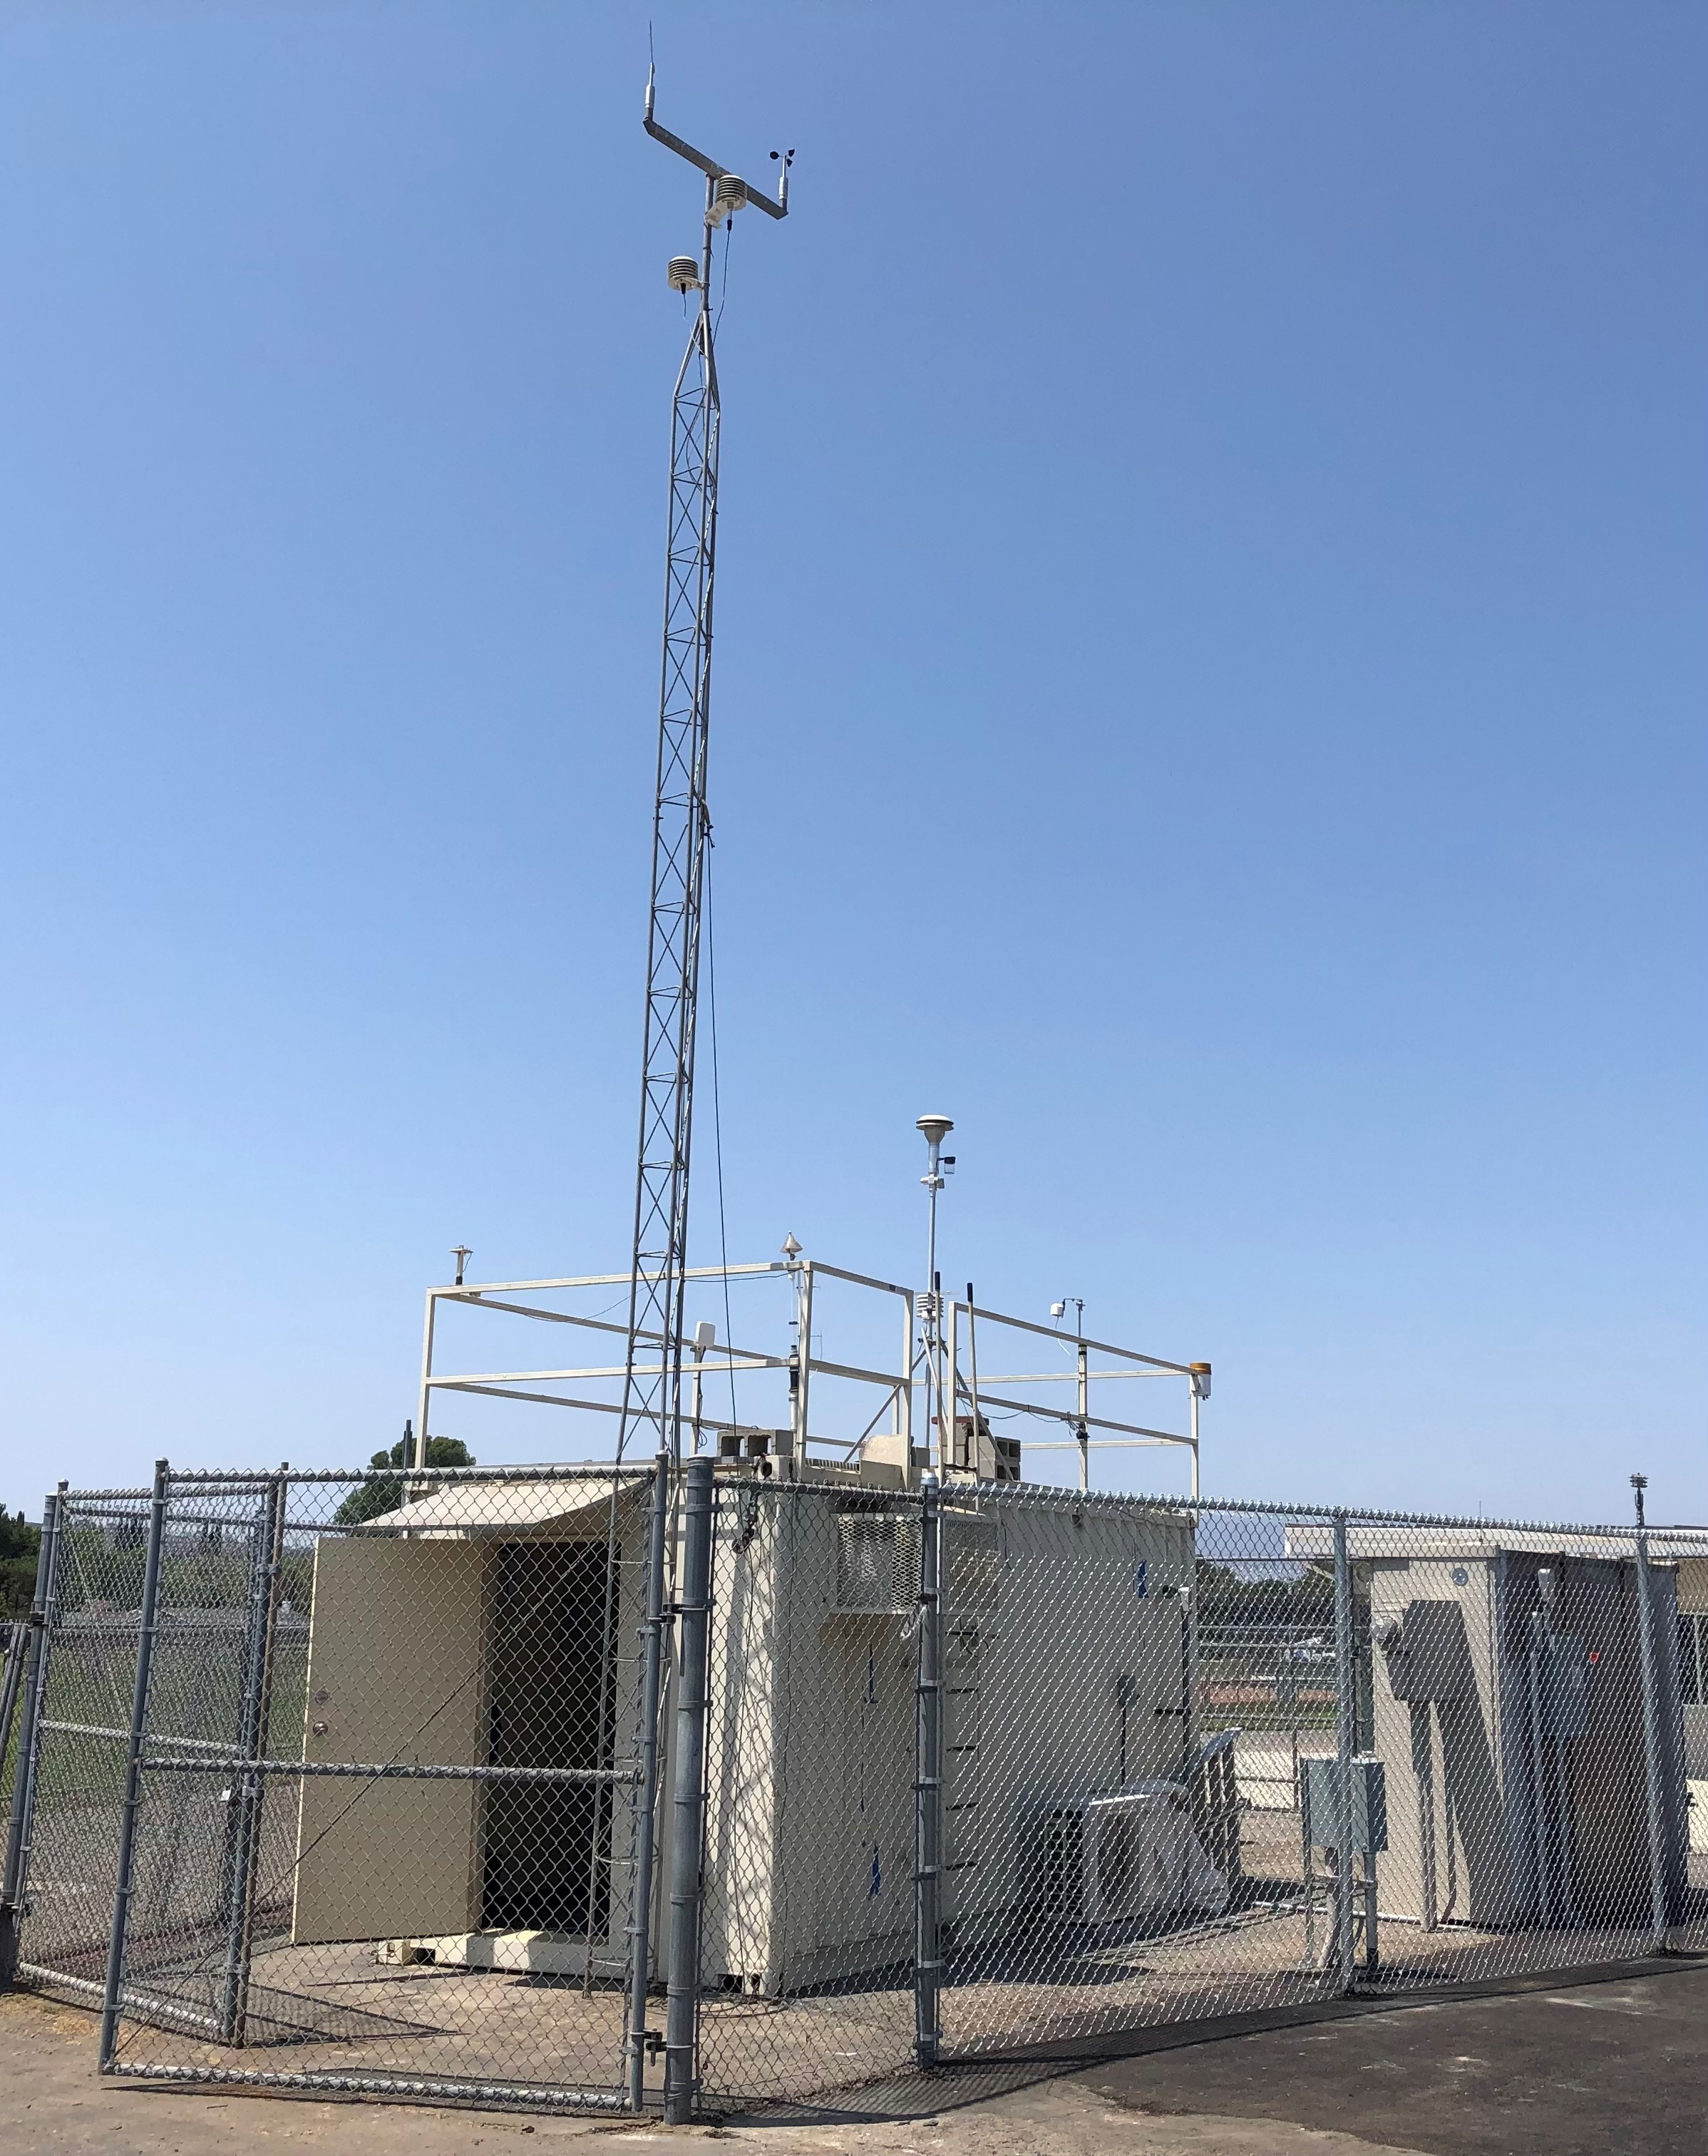
That's why the district's Monitoring Division technicians,
air quality specialists and meteorologists maintain and
operate the sophisticated gaseous pollutant analyzers and
particle monitors that determine the type and level of
pollutants in the outside air at stations in El Rio
(Oxnard), Ojai, Piru, Simi Valley and Thousand Oaks.
These monitoring stations also record near-surface
atmospheric data because weather conditions are crucial to
the formation and movement of air pollution. Sensors measure
relative humidity, ultraviolet and solar radiation,
barometric pressure, surface temperature, wind and
precipitation. In addition, at the Simi Valley monitoring
station, a remote-sensing instrument known as a ceilometer
measures cloud height, vertical visibility and potential
backscatter signals by aerosols thousands of feet above the
surface.
For information about each station including real-time ozone
and fine particulate levels, visit the
Monitoring Stations page.
 The
district’s quality assurance program ensures valid and
representative air pollution and weather data from each
monitoring station. Ventura County’s historical summaries of
pollutant data and air quality trends are available on the
Air Quality Data and Statistics page. Additional air
quality data analysis is available from the district upon
request. Air quality data for the entire state can be found
on the
California Air Resources Board Air Quality Data Statistics
page.
The
district’s quality assurance program ensures valid and
representative air pollution and weather data from each
monitoring station. Ventura County’s historical summaries of
pollutant data and air quality trends are available on the
Air Quality Data and Statistics page. Additional air
quality data analysis is available from the district upon
request. Air quality data for the entire state can be found
on the
California Air Resources Board Air Quality Data Statistics
page.
Daily air quality, weather and agricultural burn statuses
and forecasts for Ventura County are available on
this district's forecast page. Local news media also
report daily air quality using the Air Quality Index (AQI).
Air quality conditions are identified as "Good," "Moderate,"
"Unhealthy for Sensitive Groups," "Unhealthy" (for all) or
"Very Unhealthy." In recent years, Ventura County's worst
air quality days have been in the "Unhealthy" range. Local
air quality has continued to improve, and the number of days
in the unhealthy ranges has been declining.
When air quality falls in the unhealthy range, children,
older adults and those with certain health problems should
curtail their physical activity. For more AQI-related health
guidance, visit the district’s
Air Quality Index page.
Smog
 Smog
is measured as ground-level ozone concentration. To measure
it, outside air is pulled into an ozone analyzer instrument
inside each monitoring station. Inside the instrument, the
air sample passes through a tube, where an ultraviolet (UV)
light at a certain wavelength shines through it. The amount
of UV light that passes through the air sample in the tube
generates a voltage signal that is proportional to the ozone
concentration in the air sample.
Smog
is measured as ground-level ozone concentration. To measure
it, outside air is pulled into an ozone analyzer instrument
inside each monitoring station. Inside the instrument, the
air sample passes through a tube, where an ultraviolet (UV)
light at a certain wavelength shines through it. The amount
of UV light that passes through the air sample in the tube
generates a voltage signal that is proportional to the ozone
concentration in the air sample.
Oxides of nitrogen are also analyzed using complex methods
and continuous analyzers.
Particles
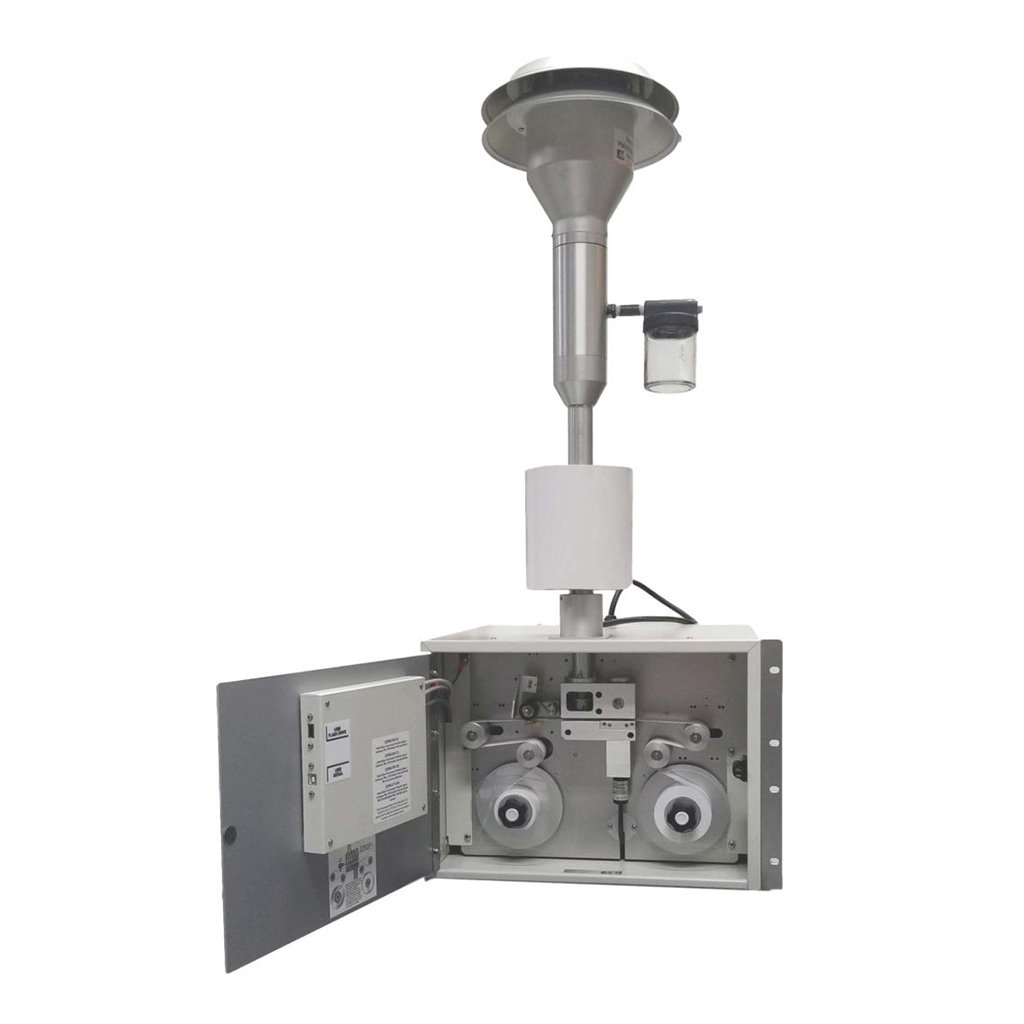 Microscopic-sized
particles in the air we breathe called particulate matter
(PM) also cause adverse health effects. The district’s
monitors record ambient, or outdoor, particulate mass
concentration levels using the principle of beta ray
attenuation. Beta rays traverse a path through glass fiber
filter tape before being detected. At the beginning of the
measurement cycle, the beta ray count across clean filter
tape is recorded. Then, an external pump pulls a known
volume of PM-laden air through the filter tape, thereby
trapping the PM on the filter tape. At the end of the
measurement cycle, the beta ray count is re-measured across
the PM-laden filter tape. The ratio of the hourly mass of
collected PM on the filter tape to the volume of air is used
to determine the amount of pollution.
Microscopic-sized
particles in the air we breathe called particulate matter
(PM) also cause adverse health effects. The district’s
monitors record ambient, or outdoor, particulate mass
concentration levels using the principle of beta ray
attenuation. Beta rays traverse a path through glass fiber
filter tape before being detected. At the beginning of the
measurement cycle, the beta ray count across clean filter
tape is recorded. Then, an external pump pulls a known
volume of PM-laden air through the filter tape, thereby
trapping the PM on the filter tape. At the end of the
measurement cycle, the beta ray count is re-measured across
the PM-laden filter tape. The ratio of the hourly mass of
collected PM on the filter tape to the volume of air is used
to determine the amount of pollution.
PM is sampled on separate instruments for 2.5-micron and
10-micron sizes. (Ten microns equals about one-seventh the
diameter of a human hair). The district monitors PM
continuously at its five air monitoring stations.
Individual PM particles are too small to be seen, but
collectively they are visible — sometimes in haze, smoke,
exhaust or windblown dust.
Learn more
Just because you can't see air pollution doesn't mean it
isn't there. That's why the district keeps a close watch on
air quality levels to protect public health and welfare from
the adverse effects of pollution.
For more information about monitoring the air or to arrange
a tour of the district's lab or forecasting center, call
(805) 303-3890.