Air Quality Forecast + Agricultural Burn Status
| |||
The Ventura County AQ forecast for the afternoon of Monday January 13 through Wednesday January 15, 2025 is UNHEALTHY for SENSITIVE GROUPS with the potential to reach UNHEALTHY for everyone due to blowing dust. Strong Santa Ana winds continue to stir up dust, which is increasing the amount of particle pollution and expected to cause the Air Quality Index (AQI) to reach UNHEALTHY for SENSITIVE GROUPS with potential to reach UNHEALTHY for everyone in the Inland Coast (Oxnard, Ventura), Camarillo, the Conejo Valley, Fillmore/Piru, and Simi Valley/Moorpark. Dust contains coarse particles that can aggravate lung disease, cause asthma attacks and acute bronchitis, and increase the risk of respiratory infections and other serious health problems. The district issues an Air Quality Watch when the AQI has reached or is forecasted to reach UNHEALTHY for SENSITIVE GROUPS with the possibility of reaching an UNHEALTHY level for all. A lower AQI can affect sensitive groups. This includes children, older adults and people with heart or lung conditions. The watch is in effect until conditions improve. When air quality reaches an unhealthy level for you or when you see wind kicking up large amounts of dust, Ventura County Public Health recommends that you: • Stay inside if possible and close all windows and doors that lead outside to prevent dust from entering. If this is not an option or it becomes extremely hot inside, seek alternate shelter. • Operate home and car air conditioners in recycle or recirculation mode. Close the fresh air intake. Change dirty filters. • If you must be outdoors, avoid strenuous activity and consider wearing a fitted N95 mask or another respirator. • If you experience a cough, fever, night sweats or painful breathing that lasts for two weeks or more, contact your doctor. The coarse particles that pose a danger are PM10, particulate matter with a diameter between 2.5 and 10 micrometers. An AQI forecast for PM10 reflects what is possible for a 24-hour day on average. At times, air quality is likely to be better or worse than what is indicated for the entire period. Levels of particle pollution and the areas affected will vary over time. Conditions can change rapidly depending on winds. For real-time data on air quality, check the AirNow NowCast AQI at www.airnow.gov. AirNow uses hourly data from the district’s five monitoring stations throughout the county to provide air quality information for the surrounding regions. People can get Daily Air Quality Reports from the district by signing up to receive emails at vcapcd.org or by following the district on the social platform X. For current weather conditions, visit www.weather.gov/lox/ |
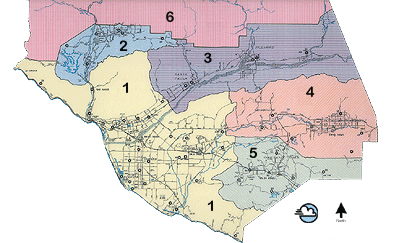
Agricultural Burn Regions
|
Agricultural Burn Status For Tuesday January 14, 2025 | |||||||
Burn Region | 1 | 2 | 3 | 4 | 5 | 6 < 3k ft | 6 > 3k ft |
Early Morning (7 a.m. - 10 a.m.) | No | No | No | No | No | No | No |
Late Morning (10 a.m. - noon) | No | No | No | No | No | No | No |
Afternoon (noon - 4 p.m.) | No | No | No | No | No | No | No |
Permit Must be Obtained from a Ventura County Fire Station | |||||||
Air Quality Index Report for Ozone (O3) and Particulates (PM) | |||||||||||||||||||||||||||||
250 | 72 | 109 | 101 | 44 | 37 | 68 | 61 | 38 | 37 | 101 | 100 | 37 | 35 | 103 | 101 | 33 | 37 | 102 | 102 | 36 | |||||||||
200 | |||||||||||||||||||||||||||||
150 | |||||||||||||||||||||||||||||
100 | |||||||||||||||||||||||||||||
50 | |||||||||||||||||||||||||||||
PM | PM | PM | PM | O3 | PM | PM | O3 | O3 | PM | PM | O3 | O3 | PM | PM | O3 | O3 | PM | PM | O3 | ||||||||||
Coastal Plain | Ojai Valley | Conejo Valley | Fillmore/Piru | Simi Valley Moorpark | |||||||||||||||||||||||||
Recorded Mon. 1/13 Forecast Tue. 1/14 Forecast Wed. 1/15 Forecast Thu. 1/16 |
1-50 Good | 51-100 Moderate | 101-150 Unhealthy for Sensitive Groups | 151-200 Unhealthy | 201-300 Very Unhealthy |
Ventura County Temperature & Precipitation Report | ||||||||
Issued: 3:00 pm Monday January 13, 2025 | ||||||||
Region | Recorded | Forecast | ||||||
Recorded Mon. 1/13 | Forecast Tue. 1/14 | Forecast Wed. 1/15 | Forecast Thu. 1/16 | |||||
Low | High | Rain (in) | Low/High | Low/High | Low/High | |||
Coastal Plain (Ventura-Oxnard-Camarillo) | 52 | 63 | 0.00 | 46/71 | 45/69 | 46/66 | ||
Ojai Valley | 32 | 63 | 0.00 | 36/72 | 34/70 | 45/69 | ||
Conejo Valley (Thousand Oaks) | 51 | 60 | 0.00 | 44/65 | 44/67 | 42/67 | ||
Fillmore - Piru | 46 | 63 | 0.00 | 44/67 | 44/67 | 43/69 | ||
Simi Valley | 51 | 57 | 0.00 | 45/63 | 47/66 | 47/67 |
All text and images © Copyright, 2006 by Ventura County Air Pollution Control District
Site design by VCAPCD Information Systems Division
E-mail Webmaster