Ventura County Air Quality
Ventura County’s air quality has improved significantly
since the district was created in 1968 even though the
population has doubled. The graphs below plot ozone and
particulate matter data against the National Ambient Air
Quality Standards (NAAQS). The Environmental Protection
Agency (EPA) periodically reviews the standards and
sometimes lowers them based on the most recent science and
epidemiological studies.
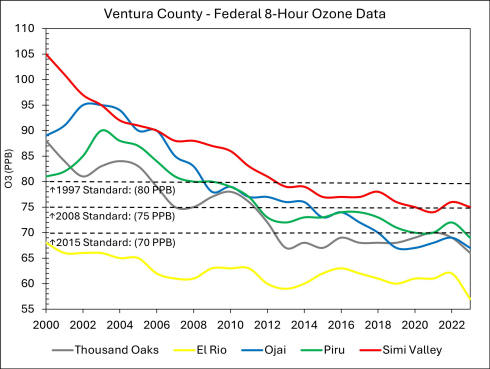
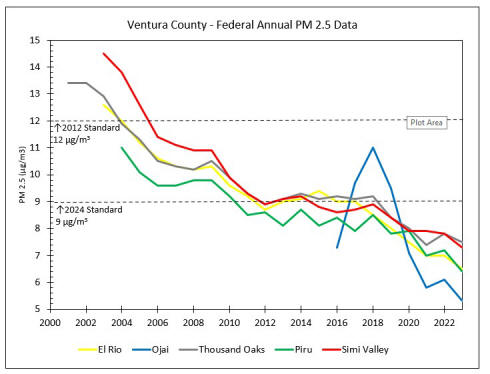
Although ambient, or outdoor, air quality data indicates
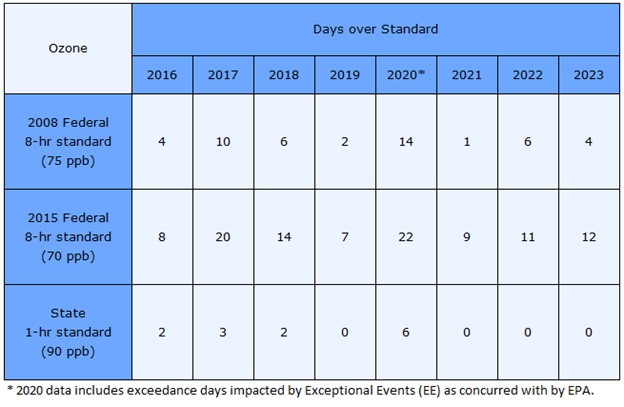
significant progress in ozone and particulate levels, the county still exceeds current state and federal
standards for ozone and the state standard for larger
particles (particulate matter with a diameter up to 10
micrometers, or PM 10). The table below shows our progress
toward these standards.
Emissions from motor vehicles and other mobile sources
account for more than half of Ventura County's air
pollution. Other pollution sources include business
operations, household products and fires.
A combination of factors often keeps emissions in Ventura
County’s atmosphere where they can negatively affect
people’s health. Frequently, there is a layer of warm air
that prevents cooler air below it from rising, acting as a
“ceiling” that traps emissions close to the ground.
Meanwhile, our mountain ranges act as “walls” that prevent
pollutants from spreading out horizontally. In addition,
early morning breezes typically push pollutants west toward
the ocean, and afternoon currents push them back to the
east, mixing new emissions with older ones and keeping them
in the air for several days. Air pollutants may not
originate from where they are measured and, in some cases,
can be transported over long distances.
When these stagnant atmospheric conditions align with warm
temperatures, typically from May through October, sunlight
reacts with pollutants to form elevated concentrations of
ground-level ozone, the principal component of smog.
The strong Santa Ana winds that Ventura County frequently
experiences, along with wildfires sometimes fueled by them,
also affect air quality. Strong winds stir up dust
containing PM 10. Wildfires fill the air with smoke and ash
containing fine particles (particulate matter with a
diameter of 2.5 micrometers or less, or PM 2.5). Wildfires
also create a complex mixture of gasses that can elevate
concentrations transported long distances from the fire
location.
High levels of ozone, PM 10 and PM 2.5 can all harm the
lungs and heart. Children, older adults and people with
heart disease or respiratory conditions can be affected by
lower levels of these pollutants.
The EPA developed the Air Quality Index (AQI) to communicate
safe and unsafe levels of pollutants. When AQI levels are
above 100, air quality is unhealthy for sensitive groups.
Above 150, it becomes unhealthy for all. Knowing the air
quality in your area can help you better plan your
activities. Residents can view real-time data on Ventura
County air quality and forecasts on the
AirNow website or app. AirNow uses hourly data from the
district’s monitoring stations in El Rio, Ojai, Piru, Simi
Valley and Thousand Oaks.